Personal Project
Real-Time Equipment Status Dashboard – LAN & Public View
A real-time equipment monitoring dashboard with an internal LAN interface and a public-facing static page updated via a backend script.
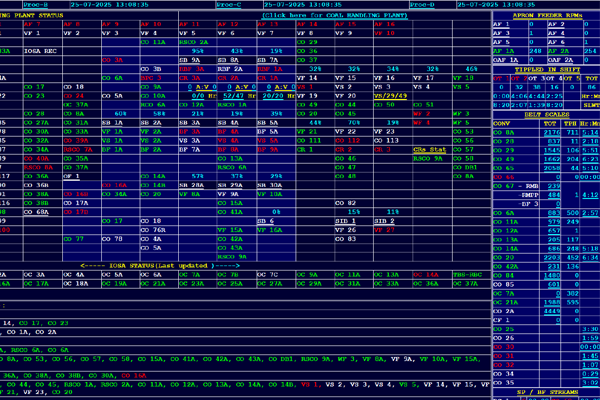
📍 Overview: This project is a real-time equipment monitoring web application that displays the status of industrial machines from various PLC systems. It features two distinct interfaces: a full-featured internal LAN dashboard and a lightweight, public-facing static page for remote access.
🔄 Data Pipeline:
- A Python script runs every minute to collect data from Siemens, GE, and Micrologix PLCs.
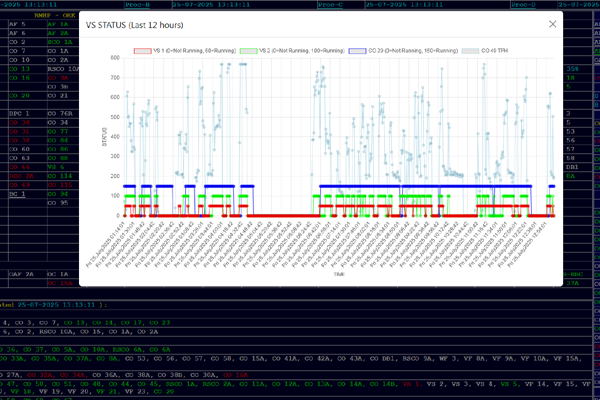
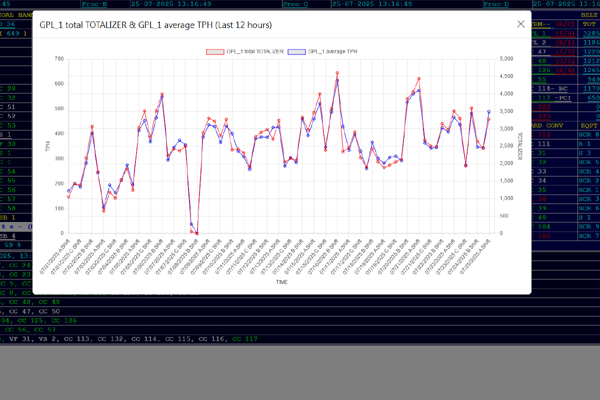
- Processed data is written to a MySQL database, with a 6-month retention for trend analysis.
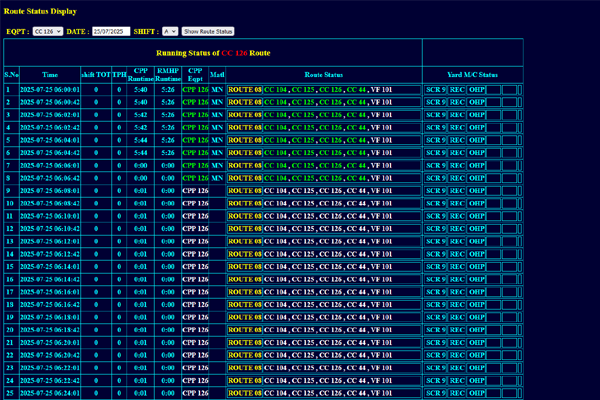
- A Flask server reads from MySQL to render the real-time LAN dashboard.
- The public GitHub Pages site is updated every minute by the same script.
🛠️ Technical Stack:
- Frontend: HTML, CSS, Jinja2 templating.
- Backend: Python (Flask), SQL (MySQL), and scheduled Python scripts.
- Hosting: IIS Server on Windows for the LAN version, and GitHub Pages for the public version.
📚 Key Learnings: Real-time web application design, fetching data from multiple PLC protocols, building interactive UI modules (popups, trends), and creating a dual-access system with automated data syncing.